Investments
| Investment income | ||||||
|---|---|---|---|---|---|---|
| in EUR million | 2014 | +/ - previous year |
2013 | 2012 | 2011 | 2010 |
| Ordinary investment income1 | 1,068.4 | +2.6% | 1,041.3 | 1,088.4 | 966.2 | 880.5 |
| Result from participations in associated companies | 1.0 | -91.7% | 12.5 | 10.4 | 3.1 | 3.9 |
| Realised gains/losses | 182.5 | +26.6% | 144.2 | 227.5 | 179.6 | 162.0 |
| Appreciation | 0.1 | -60.8% | 0.3 | 2.7 | 36.8 | 27.2 |
| Depreciation, amortisation, impairments 2 | 27.7 | +42.6% | 19.4 | 21.7 | 31.0 | 23.8 |
| Change in fair value of financial instruments3 | (33.3) | (27.1) | 89.3 | (38.8) | (39.9) | |
| Investment expenses | 95.3 | -2.1% | 97.3 | 96.4 | 70.3 | 67.4 |
| Net investment income from assets under own management | 1,095.8 | +3.9% | 1,054.5 | 1,300.2 | 1,045.5 | 942.5 |
| Net investment income from funds withheld | 376.1 | +5.2% | 357.3 | 355.5 | 338.5 | 316.4 |
| Total investment income | 1,471.8 | +4.3% | 1,411.8 | 1,655.7 | 1,384.0 | 1,258.9 |
| 1 Excluding expenses on funds withheld and contract deposits 2 Including depreciation / impairments on real estate 3 Portfolio at fair value through profit or loss and trading |
||||||
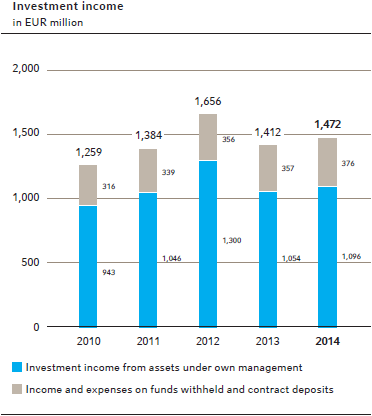
Ordinary investment income excluding interest on funds withheld and contract deposits showed a pleasing development to reach EUR 1,068.4 million (previous year: EUR 1,041.3 million) despite the continued low level of interest rates. Interest on funds withheld and contract deposits improved slightly on the previous year to EUR 376.1 million (EUR 357.3 million). Net realised gains on disposals were considerably higher than in the previous year at EUR 182.5 million (EUR 144.2 million). This was due in part to the change in reporting currency at our Bermuda subsidiaries, the redemption of our bond issued in 2004 and regrouping moves as part of regular portfolio management, although we also acted on opportunities in the real estate sector.
We recognise a derivative for the credit risk associated with special life reinsurance treaties (ModCo) under which securities deposits are held by cedants for our account; the performance of this derivative in the year under review gave rise to negative fair value changes recognised in income of EUR 6.8 million, as against positive fair value changes recognised in income of EUR 7.4 million in the previous year. The inflation swaps taken out to hedge part of the inflation risks associated with the loss reserves in our technical account produced negative fair value changes of EUR 28.8 million (-EUR 41.0 million) over the course of the year. These fair value changes are recognised in income as a derivative pursuant to IAS 39. We assume an economically neutral development for these two items, and hence the volatility that can occur in specific reporting periods has no bearing on the actual business performance. Altogether, the negative changes in the fair values of our financial assets recognised at fair value through profit or loss amounted to EUR 33.3 million (EUR 27.1 million).

Impairments and depreciation totalling just EUR 27.7 million (EUR 19.4 million) were taken. Scheduled depreciation on directly held real estate amounted to EUR 18.5 million (EUR 14.0 million), a reflection of how we have stepped up our involvement in this sector. The vast bulk of impairments – totalling EUR 5.8 million – were attributable to alternative investments (EUR 3.5 million). These write-downs contrasted with write-ups of altogether EUR 0.1 million (EUR 0.3 million).
Our investment income (including interest on funds withheld and contract deposits) came in at EUR 1,471.8 million, a slightly higher level than in the previous year (EUR 1,411.8 million). This can be attributed principally to the stable ordinary income combined with higher realised gains. Of this amount, income from assets under own management accounted for EUR 1,095.8 million (EUR 1,054.5 million). This produces an average return (excluding effects from inflation swaps and ModCo derivatives) of 3.3%; that this figure is somewhat higher than our forecast of 3.2% reflects among other things increased realised gains on fixed-income securities as well as the fact that we acted on opportunities to realise gains in the real estate sector. Parallel to the rising investment income, the valuation reserves in the investment portfolio for our available-for-sale asset holdings rose by EUR 971.2 million to EUR 1,724.0 million.
More Information
Topic related links within the report:


