Investments

Investments
(To visualize the indicators, please move your mouse to the appropriate line in the table.)
| Investment income | ||||||
|---|---|---|---|---|---|---|
| in EUR million | 2013 | +/– previous year |
2012 | 2011 | 2010 | 2009 |
| Ordinary investment income1 | 1,041.3 | -4.3% | 1,088.4 | 966.2 | 880.5 | 810.5 |
| Result from participations in associated companies | 12.5 | +20.4% | 10.4 | 3.1 | 3.9 | (5.0) |
| Realised gains/losses | 144.2 | -36.6% | 227.5 | 179.6 | 162.0 | 113.0 |
| Appreciation | 0.3 | -88.1% | 2.7 | 36.8 | 27.2 | 20.1 |
| Depreciation, amortisation, impairments2 | 19.4 | -10.7% | 21.7 | 31.0 | 23.8 | 142.5 |
| Change in fair value of financial instruments3 | (27.1) | -130.4% | 89.3 | (38.8) | (39.9) | 100.6 |
| Investment expenses | 97.3 | +1.0% | 96.4 | 70.3 | 67.4 | 53.1 |
| Net investment income from assets under own management | 1,054.5 | -18.9% | 1,300.2 | 1,045.5 | 942.5 | 843.6 |
| Net investment income from funds withheld | 357.3 | +0.5% | 355.5 | 338.5 | 316.4 | 276.8 |
| Total investment income | 1,411.8 | -14.7% | 1,655.7 | 1,384.0 | 1,258.9 | 1,120.4 |
| 1 Excluding expenses on funds withheld and contract deposits 2 Including depreciation/impairments on real estate 3 Portfolio at fair value through profit or loss and trading |
||||||
In view of the sustained low level of interest rates, ordinary investment income excluding income from funds withheld and contract deposits developed in line with our expectations at EUR 1,041.3 million (previous year: EUR 1,088.4 million). Income from funds withheld and contract deposits, on the other hand, came in slightly higher than in the previous year at EUR 357.3 million (EUR 355.5 million). The net realised gains on disposals amounted to a very pleasing EUR 144.2 million (EUR 227.5 million) and derived principally from regrouping moves as part of regular portfolio management as well as from the change in reporting currency at our subsidiary in Bermuda. This figure was, however, lower than in the previous year, when we had acted to a greater extent on opportunities in the real estate sector.
We also recorded exceptionally positive changes in the fair values of our financial assets recognised at fair value through profit or loss (EUR 89.3 million), contrasting with a negative fair value change of EUR 27.1 million as at 31 December 2013. This can be attributed primarily to the performance of the ModCo derivatives and the inflation swaps. We recognise a derivative for the credit risk associated with special life reinsurance treaties (ModCo) under which securities deposits are held by cedants for our account; the performance of this derivative in the period under review gave rise to positive fair value changes recognised in income of EUR 7.4 million (EUR 51.8 million). The inflation swaps taken out in 2010 and 2011 to hedge part of the inflation risks associated with the loss reserves in our technical account produced negative fair value changes of EUR 41.0 million, as against a positive contribution of EUR 28.0 million in the previous year. The changes in the fair values of the inflation swaps are recognised in income as a derivative pursuant to IAS 39. Over the entire term we assume for the most part an economically neutral development for these two items for Hannover Re, and hence the volatility that can occur in specific periods has no bearing on the actual business performance.
Impairments and depreciation totalling just EUR 19.4 million (EUR 21.7 million) were taken. By far the bulk of the impairments – amounting to EUR 3.5 million – were attributable to alternative investments (EUR 5.8 million). Scheduled depreciation taken on directly held real estate amounted to EUR 14.0 million (EUR 10.4 million), a reflection of our greater involvement in this area. These write-downs contrasted with write-ups of EUR 0.3 million (EUR 2.7 million).
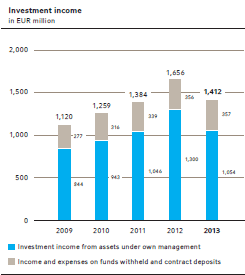
Principally due to reduced realised gains and a lower result from investments measured at fair value through profit or loss, our investment income fell short of the previous year’s level. It stood at EUR 1,411.8 million (EUR 1,655.7 million) in the reporting period, of which EUR 1,054.5 million (EUR 1,300.2 million) was attributable to assets under own management. This produces an average return (excluding effects from inflation swaps and ModCo derivatives) of 3.4%, a figure in line with our forecast.
