Financial Highlights
Semtech Fiscal Year 2016
Balance Sheet Data (in thousands)
| FY 2012 | FY 2013 | FY 2014 * | FY 2015 ** | FY 2016 | |
|---|---|---|---|---|---|
| Cash, cash equivalents and investments | $327,665 | $236,072 | $246,868 | $230,328 | $211,810 |
| Working Captial | $360,330 | $248,311 | $282,706 | $288,647 | $237,334 |
| Total Assets | $726,321 | $1,171,013 | $948,940 | $929,431 | $911,517 |
| Long-term debt, less current portion | $ – | $282,286 | $273,293 | $234,746 | $239,177 |
| Other long-term liabilities | $29,151 | $36,219 | $28,914 | $35,286 | $40,402 |
| Total sockholders' equity | $630,188 | $694,826 | $535,843 | $551,358 | $528,051 |
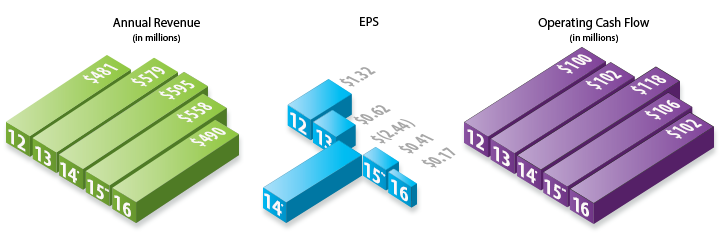
* FY 2014 Earnings per share (EPS) impacted by restructuring and impairment related charges of $181.5 from the strategic decision to reduce the level of investment made in the optical long-haul market.
** FY 2015 EPS impacted by restructuring and impairment related charges of $25.1 from the strategic decision to conclude investment in defense and microwave communications infrastructure markets